Pandana
A Python/Pandas library for data aggregations on a network
Pandana was created as part of my dissertation which is work done with Paul Waddell as advisor. Most of the polish of the library was done by Matt Davis (@jiffyclub) for work done at Synthicity.
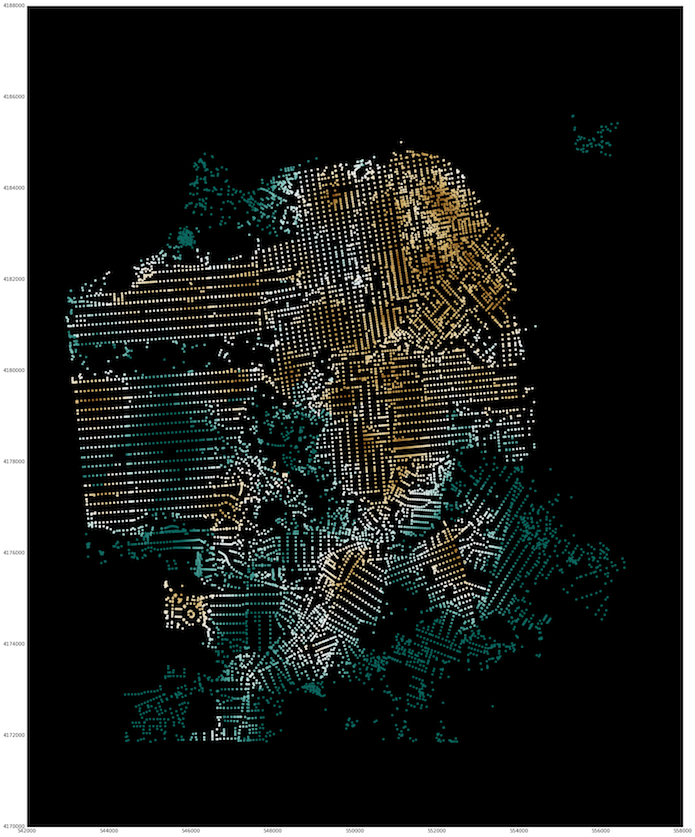
Pandana is a neoligism for Pandas Network Analysis, which follows somewhat the kinds of functionality provided in ESRI's network analyst, but with a Pandas-style interface. Basically, the user of the library can do aggregations along the network of any kind of spatially located data.
For instance, once you've inititalized the network, you can set data in relation to that network, like the income of all people in a city. You can then do buffers around each street intersection in the network and do any kind of aggregation, e.g. the 70th percentile income within 3kms, or the sum of jobs within 45 minutes ride via transit (assuming you have a network of transit lines).
The real power of this approach is twofold.
-
The core algorithms are written in C and multithreaded so the results are a fast as they can possibly be. Any reasonable walking scale aggreagtion will be sub-second for a region as large as the Bay Area.
-
The API is Pandas based and so shockingly easy to use (this has been confirmed by multiple users). Pass in a DataFrame with a data point, an X, and a Y, and get back a DataFrame with a network node id and a value for the aggregation around that node. That's it.
It's worth mentioning there are two modes of operation. The one described above, which aggregates data, and the second, with is the Nth nearest point (a network nearest neighbor), such as can be used to construct a customized WalkScore-type algorithm.
Pandana is currently in active use by multiple MPOs. If you are one of these MPOs and have a good example to post, send it to me and I will update this blog post.
Credits and resources:
-
Conor Henley gets full credit for thinking of the name. Clearly Pandana is also a reference to Panda bears wearing bandanas.
-
For basic examples (done by me) see this repo. A trivial example is here. A full-sized example is here. An example of how to create a custom WalkScore is here.
-
Geoff Boeing has a wonderful example / blog post of how to use Pandana, which is here.
-
Eli Knaap uses Pandana in his great accessibility to opportunities work in Baltimore.